
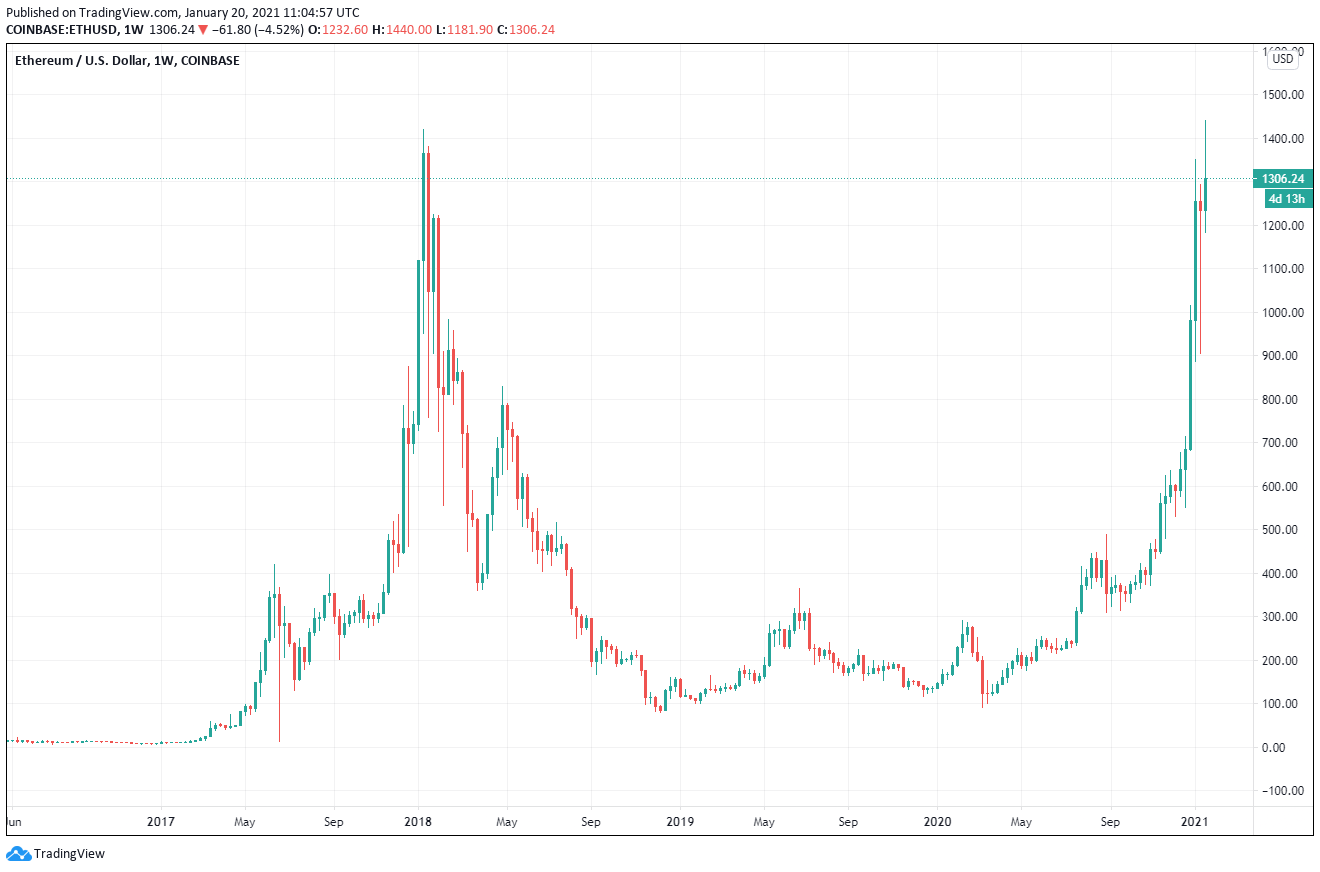
Ethereum (ETH), the second-largest cryptocurrency by market capitalization, touched the all-time high last reached in 2018 on some exchanges before a correction occurred. Time for a brief overview of the latest developments.
While Bitcoin (BTC) has been in price discovery beyond its 2017 all-time high since December, Ether (ETH) has not yet been able to break through the 2017/18 bull market high. Yesterday, the first attempt occurred and the all-time high was reached on some exchanges.
Reaching an all-time high after a bear market that lasted more than three years, underscores an ongoing evolution and adoption of a cryptocurrency. Alongside Bitcoin, Ethereum now joins its ranks. Many altcoins are far from their all-time highs reached in 2017 or did not even exist at the time. Accordingly, the price development of the second-largest cryptocurrency is not unexpected, because a lot has happened in recent years from a fundamental perspective.
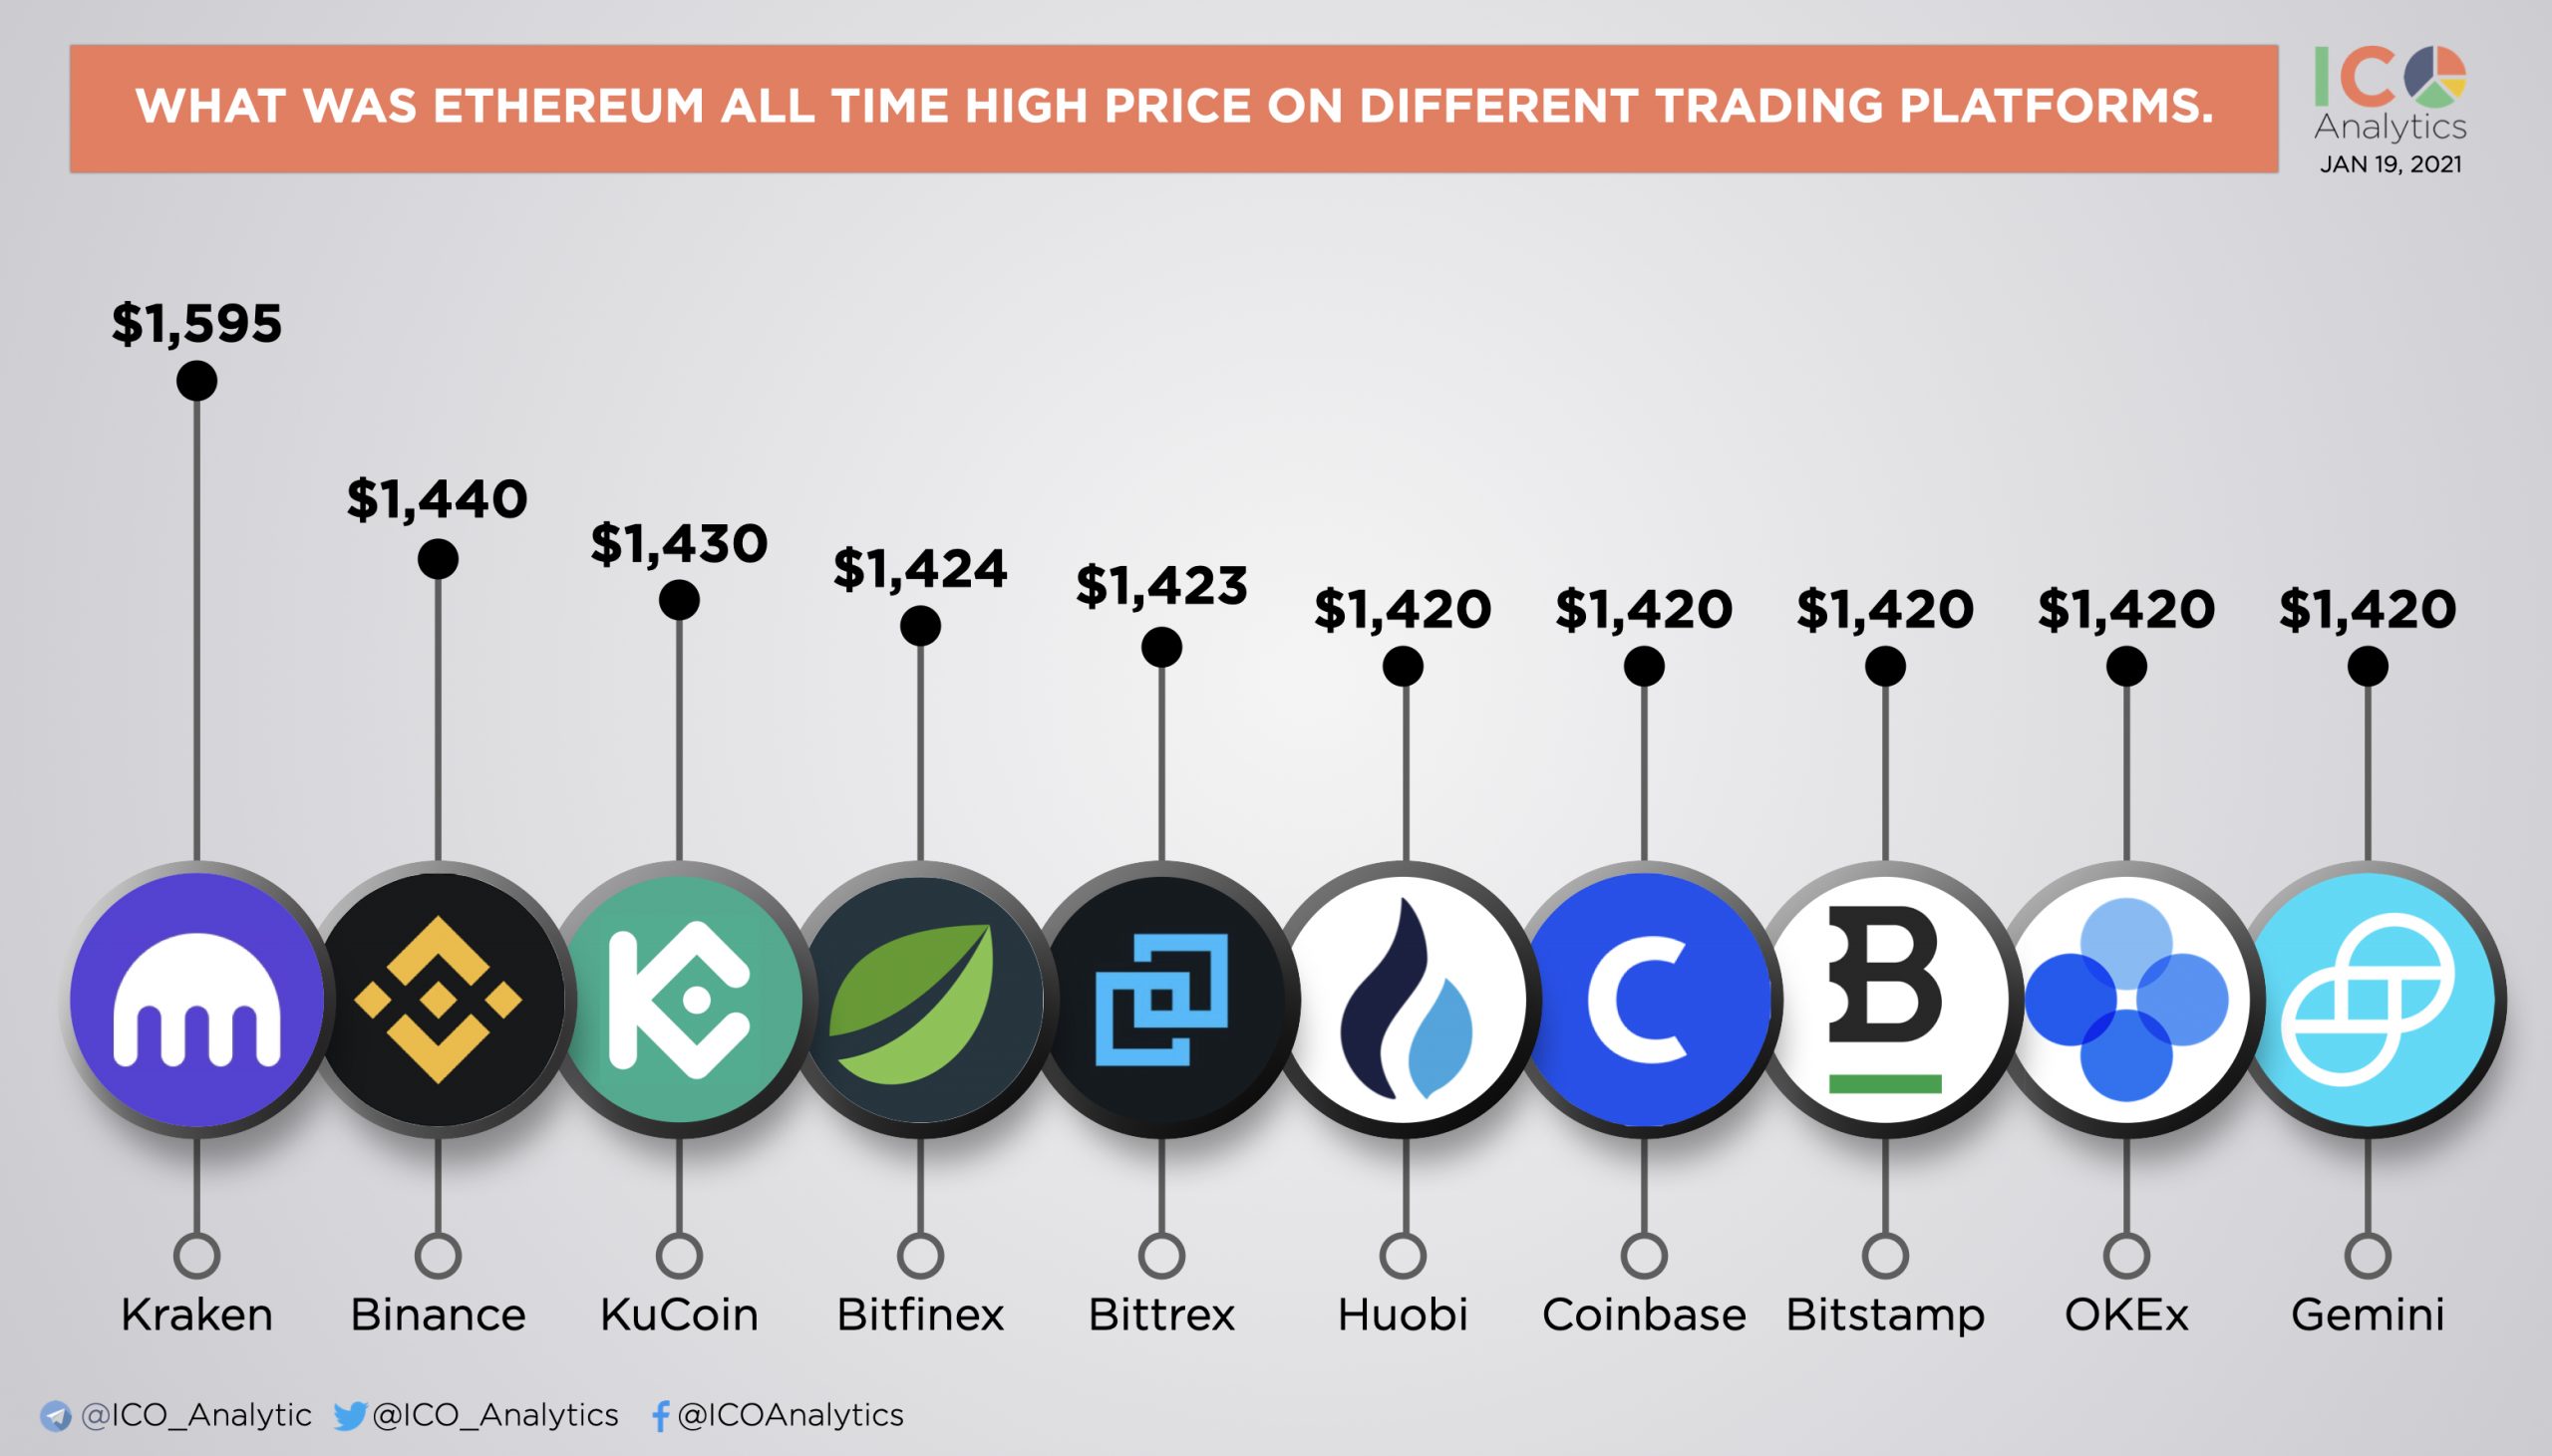
Different exchanges = different all-time highs
Since exchanges in the crypto market are their own marketplaces, independent from each other, Ethereum’s all-time high reached in January 2018 differs depending on the exchange. On most exchanges, the all-time high was marked just above $1,400.
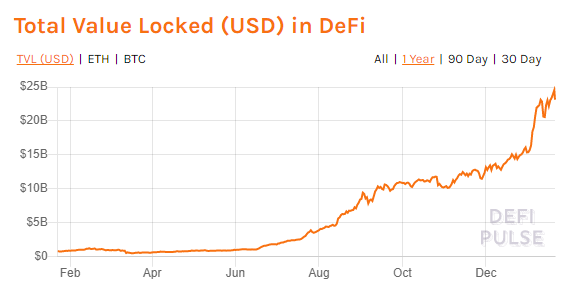
Strong Ethereum growth thanks to DeFi
In 2020, a rapidly growing new field of applications has emerged on the platform: The field of decentralized financial applications (DeFi). In general, this refers to Ethereum-based applications (dApps) that offer financing in exchange for collateral in the form of crypto assets through smart contracts. Accordingly, in the DeFi space, traditional financial services are transformed into transparent protocols that do not require intermediaries. The total value deposited in DeFi protocols is at all-time highs, currently reaching $23.14 billion. As a result, Aave (AAVE) was the first DeFi token to make it into the top 20 highest capitalized tokens.
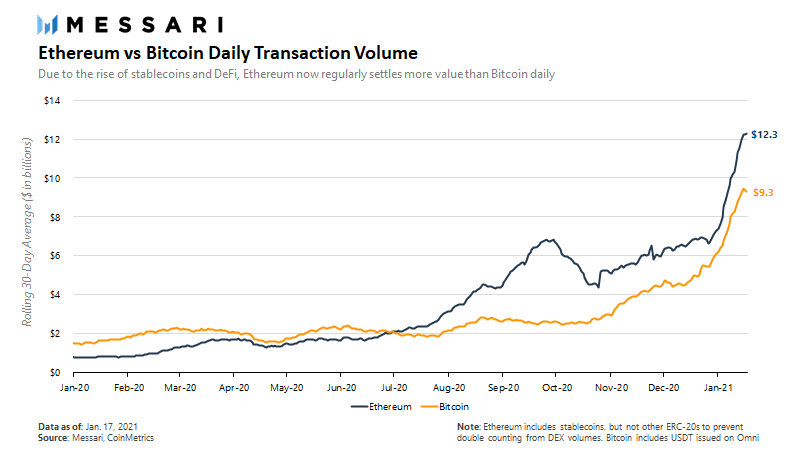
As a result of the new ecosystem on the Ethereum platform, daily transaction volume on the Ethereum blockchain surpassed that of Bitcoin last summer – a trend that’s continuing. The smart contract platform has also been able to make progress in other areas and has managed to reinvent itself a few times already in its young history.
Comparing the two largest cryptocurrencies
Comparing the price ratio between the two largest cryptocurrencies, a decreasing proportion can be seen since the 2017 bull market, which has bottomed out since the DeFi boom started. Compared to the bull run of 2017/18, the Ether to Bitcoin (ETHBTC) ratio is still some way from its all-time high.
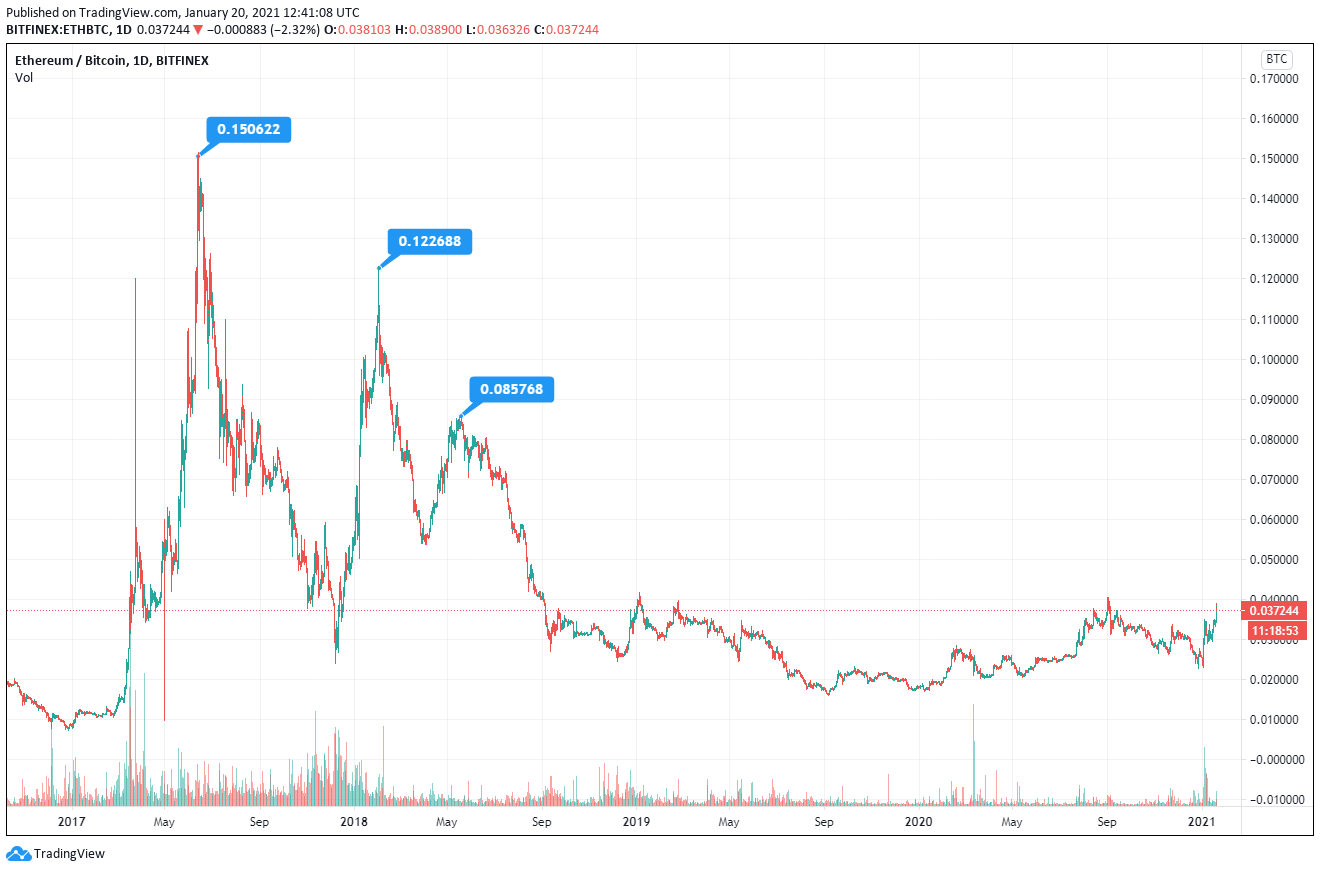
ETH/BTC ratio – At the high, 1 Ether represented 0.15 Bitcoin, currently it is 0.037 BTC / Chart: Tradingview.com
EIP 1559
A potential catalyst for Ethereum could be the introduction of the Ethereum Improvement Proposal (EIP) 1559. This is a proposal for the Ethereum protocol that aims to solve the issue of high gas fees. Another part of EIP-1559 includes a recommendation to “burn” some of the transaction fees. The so-called token burning would accordingly have a deflationary impact on the total amount circulating.
*Originally posted at CVJ.CH
