Early this morning, one of Bitcoins key indicators has signalled a “golden cross” (GC). The 50-day moving Average (MA) is set to turn bullish as crytpo’s flag-ship currency attemps to break the $10’500 resistance level. 2020 has already seen Bitcoin subject to the formation of a golden cross, most notably in February, however a true long-term bullish momentum has yet to materialize.
Golden Cross
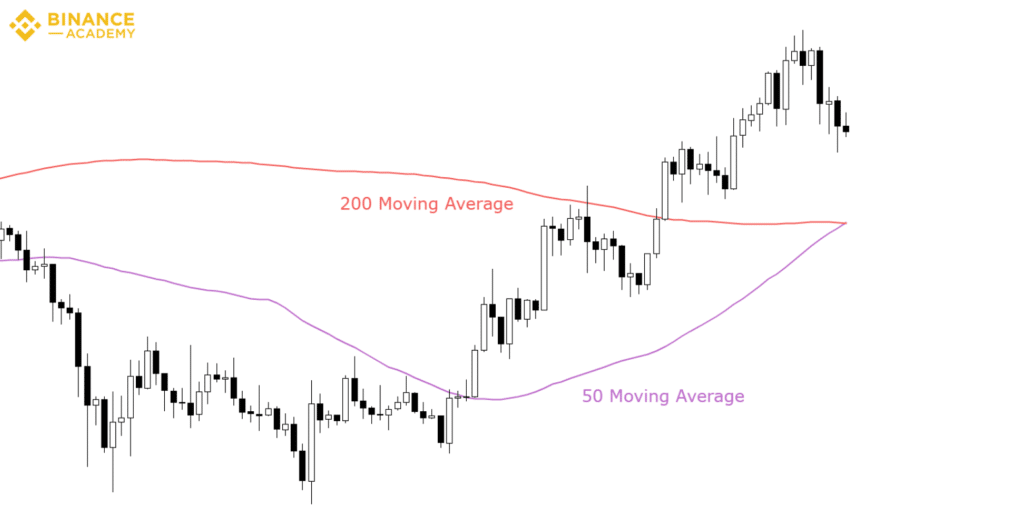
A golden cross occurs when the short-term moving average (SMA) e.g. a 50-day moving average, eclipses the long-term moving average (LMA) e.g. 200-day moving average. Such an occurance is considered to be a bullish sign.

Source: Binance Academy
GC’s occur in three stages:
- A downtrend occurs where the SMA appears below the LMA
- The market experiences a recent uptrend causing the SMA to eclipse the LMA
- Either the market maintains this bullish momentum and the SMA remains above the LMA or the market goes bearish and the SMA dips below the LMA — signalling a death cross.
Bitcoin’s Golden Crosses
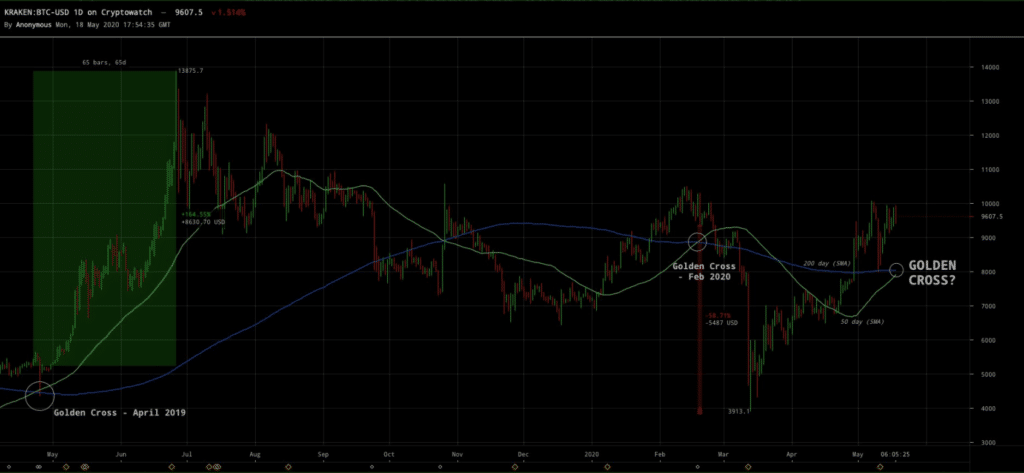
As noted above, the most recent golden cross occurred on the 18th of February. Since January 2020, Bitcoin had been up by 43.5% and in the long-term had increased by 175% since February 2019; where the price of one Bitcoin was at $3,560.
Before the February 2020 golden cross was formed, a crossover of the SMA over the LMA occured on the 24th of April 2019. At the time Bitcoin was priced at $4,400, with the bullish momentum shooting Bitcoin to its second highest-ever value of $13,900 in June. The April – June run saw the price of Bitcoin surge to 157%.
This time round, Bitcoin tested the $10,000 mark five times over the past two weeks. According to Joseph Young at Cointelegraph, this incessant testing of the 10,000 mark can be interpreted in two ways.
- The $10,000 resistance level is being slowly worn down with each breakout attempt
- The $10,000 resistance level is so fortified that a breakout is currently not possible
If the first scenario occurs, it will be the first time since May 2019 that the price of Bitcoin has managed to gain a foothold in ‘bullish-territory’. Conversely, if the second scenario comes to fruition, a price collapse to the $8500 mark could be an eventuality.

Source: Cryptowatch, Previous 3 Golden Crosses
The Resistance

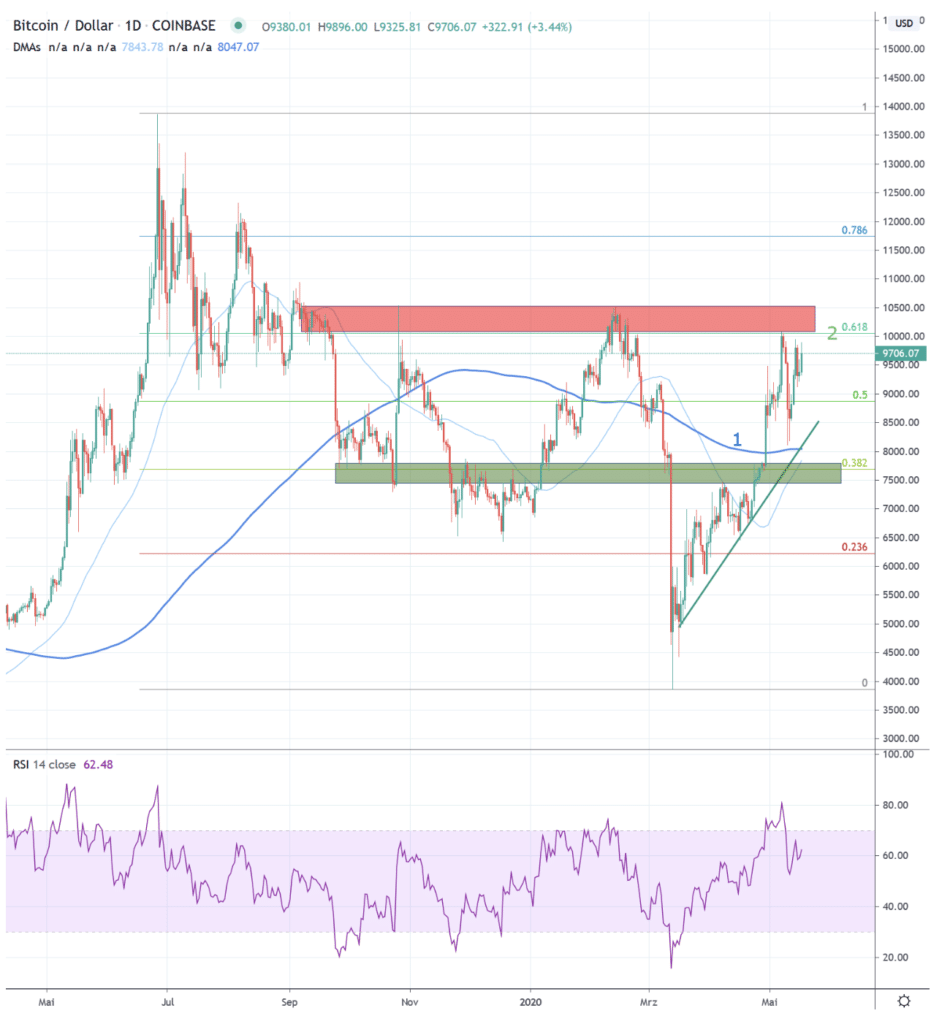
Source: MachinaTrader
Since the turn of the decade, Bitcoin has been in a continuous struggle to break out of the $10,000 resistance zone – not since June 2019 has this resistance been overcome. In the above depicted graph, CVJ have highlighted the resistance zone (red), indicating the area between $10,000 – $10,500. Additionally, support (green) at the $7’500 – 7’700 level must be apparent as a foundation for future breakout attempts to be launched.
In essence, those involved in crypto will be eagerly waiting to see if this seemingly impenetrabale resistance level can be broken down. If the 2020 high of $10,500 can be eclipsed, the long-term down-wards sloping trend could be broken and the path could be set for a re-test of the all-time high. For now, it is best to remain vigilant, perhaps this golden cross may lead to a bull-market, however no fundamental reason currently exists that would back a “bull-run hypothesis”.

