
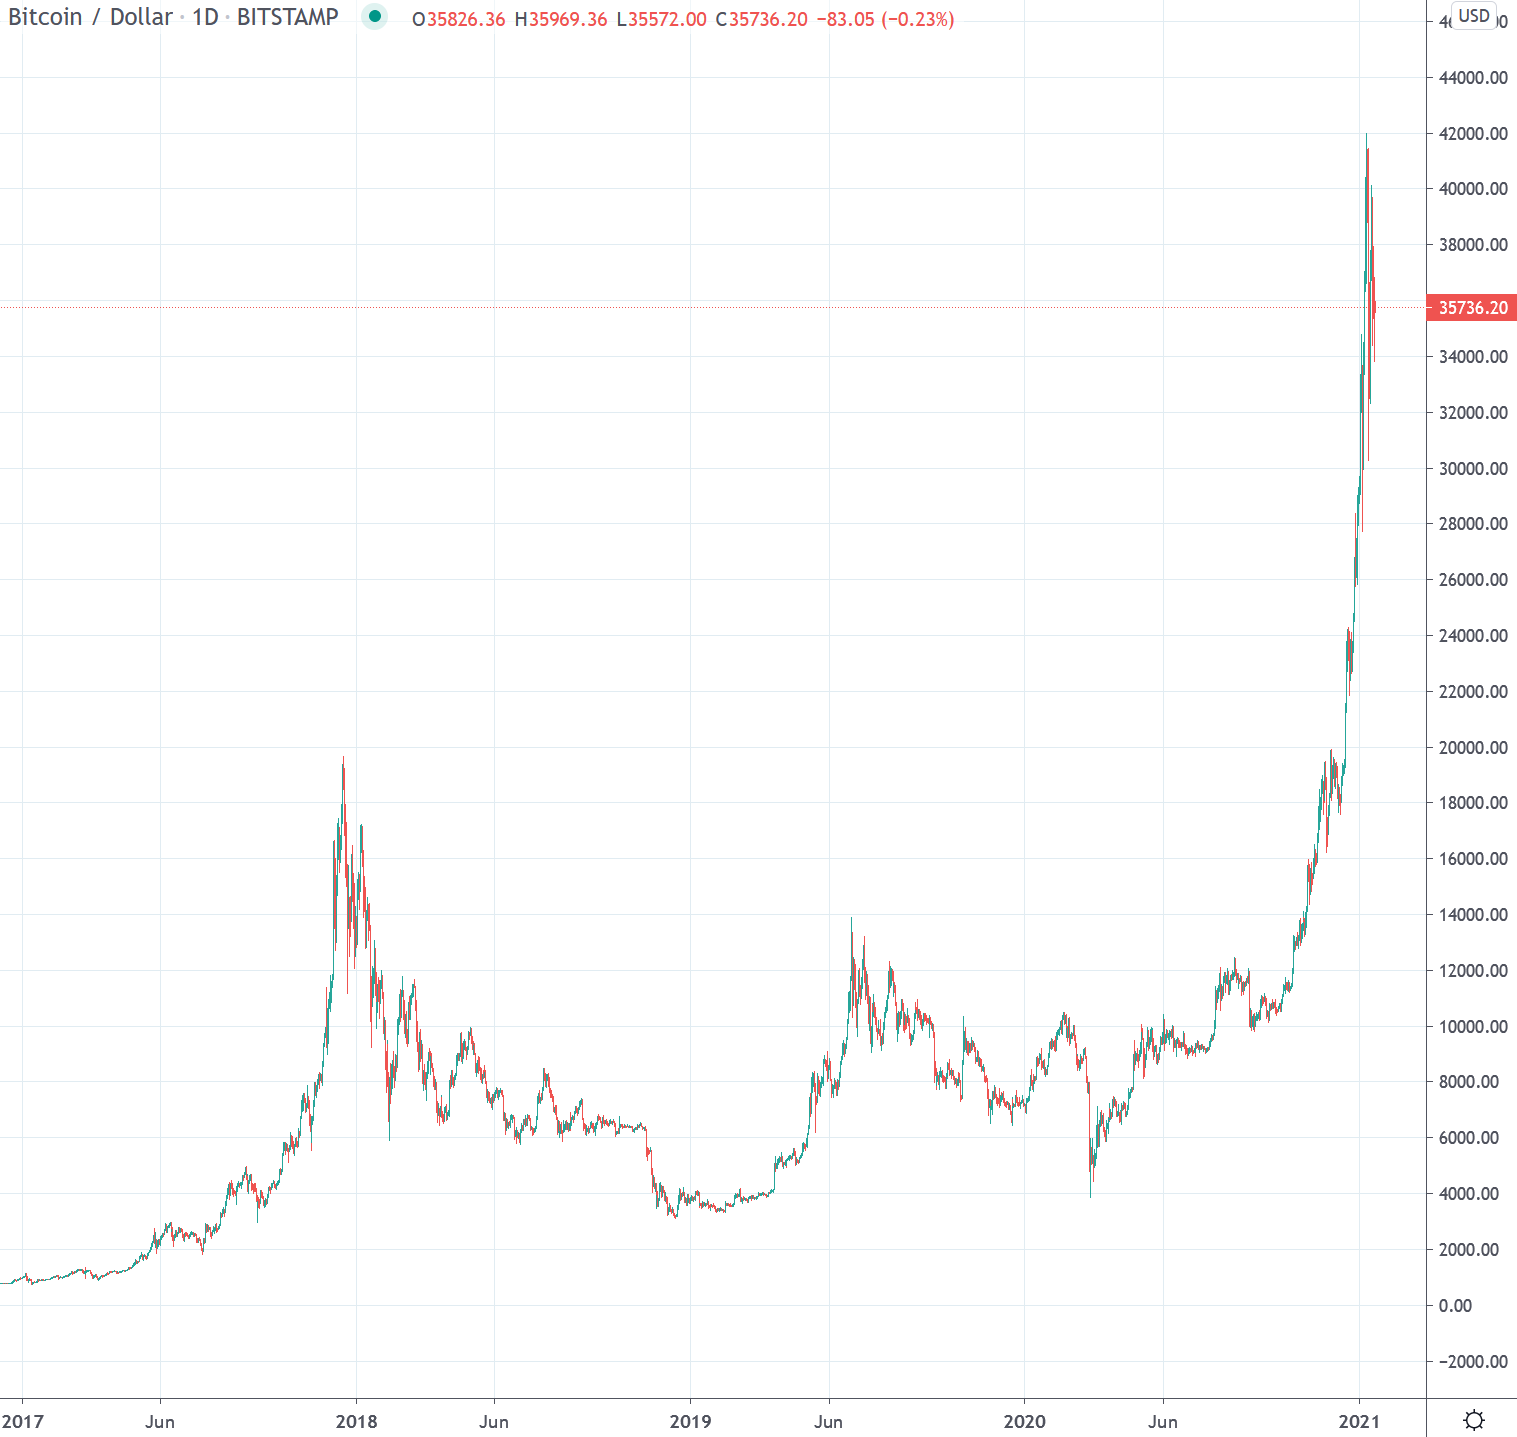
Bitcoin USD daily basis
Bitcoin USD Chart Analysis – First Consolidation Accompanied by High Volatility
The new all-time high which was reached on Friday of the previous week remains in place for the time being. At the weekend, a first consolidation set in, which was initiated on Sunday with increasing selling pressure. This brought the daily low price at the end of the week back to the 35’200 USD. This was followed on Monday by an impressive selling wave, which led the Bitcoin price back to a daily low of 30,500 USD with record volume. Remarkably, the daily close took place again above 35,000 USD, but the strongest intraday correction in months so far made the bulls realize that price setbacks still exist. Accordingly, Tuesday turned negative again, albeit to a lesser extent, and saw Bitcoin exit the market just above $34,000. In addition to the volume, the trading range was also significantly lower than the previous day – first signs of a calming in the middle of the week. With selling pressure easing, Bitcoin was able to complete a green candle for the first time in the reporting week on Wednesday, with a daily close at 37’300 USD. This was followed by another price rally on Thursday, which failed to recapture the USD 40,000 level. After another failed attempt on Friday, selling pressure set in again and led the price back to the 36’000 USD zone. At this level, the price consolidated with decreasing volatility until the weekend.
Exuberant price discovery in new territory
Review Daily Interval
After the price plunge of mid-March 2020, a veritable countermovement established itself. This led to the resistance zones from 10,000 USD. After an initial rejection and a consolidation phase lasting almost two months, a breakout through the fundamental resistance zone followed on July 27, which had been established since August 2019 and had already caused Bitcoin to fail a few times to date.
The resistance zone around USD 10,000 was interesting in several respects. On the one hand, the 0.618 Fibonacci point of the entire downward movement, which was initiated at the end of June 2019 just below 14,000 USD, is located here. On the other hand, the zone around USD 10,000 simultaneously acted as a confirmation of the still bearish trend from lower highs since December 2017 (see the macro view on a weekly basis). Bitcoin was able to establish itself above the newly created support in the USD 10,000 area since the end of July 2020 and provided the first confirmation of a trend reversal with the break of the resistance zone around USD 12,200 towards the end of October 2020. The aforementioned resistance zone had been effective since January 2018 and served as a zenith for the price several times since then. In the following weeks, the positive trend accentuated and led Bitcoin through the 14,000 resistance at the beginning of November 2020 and close to the then all-time highs around 20,000 USD for the first time in early December, which remained untouched for 158 weeks since the bull market in 2017.
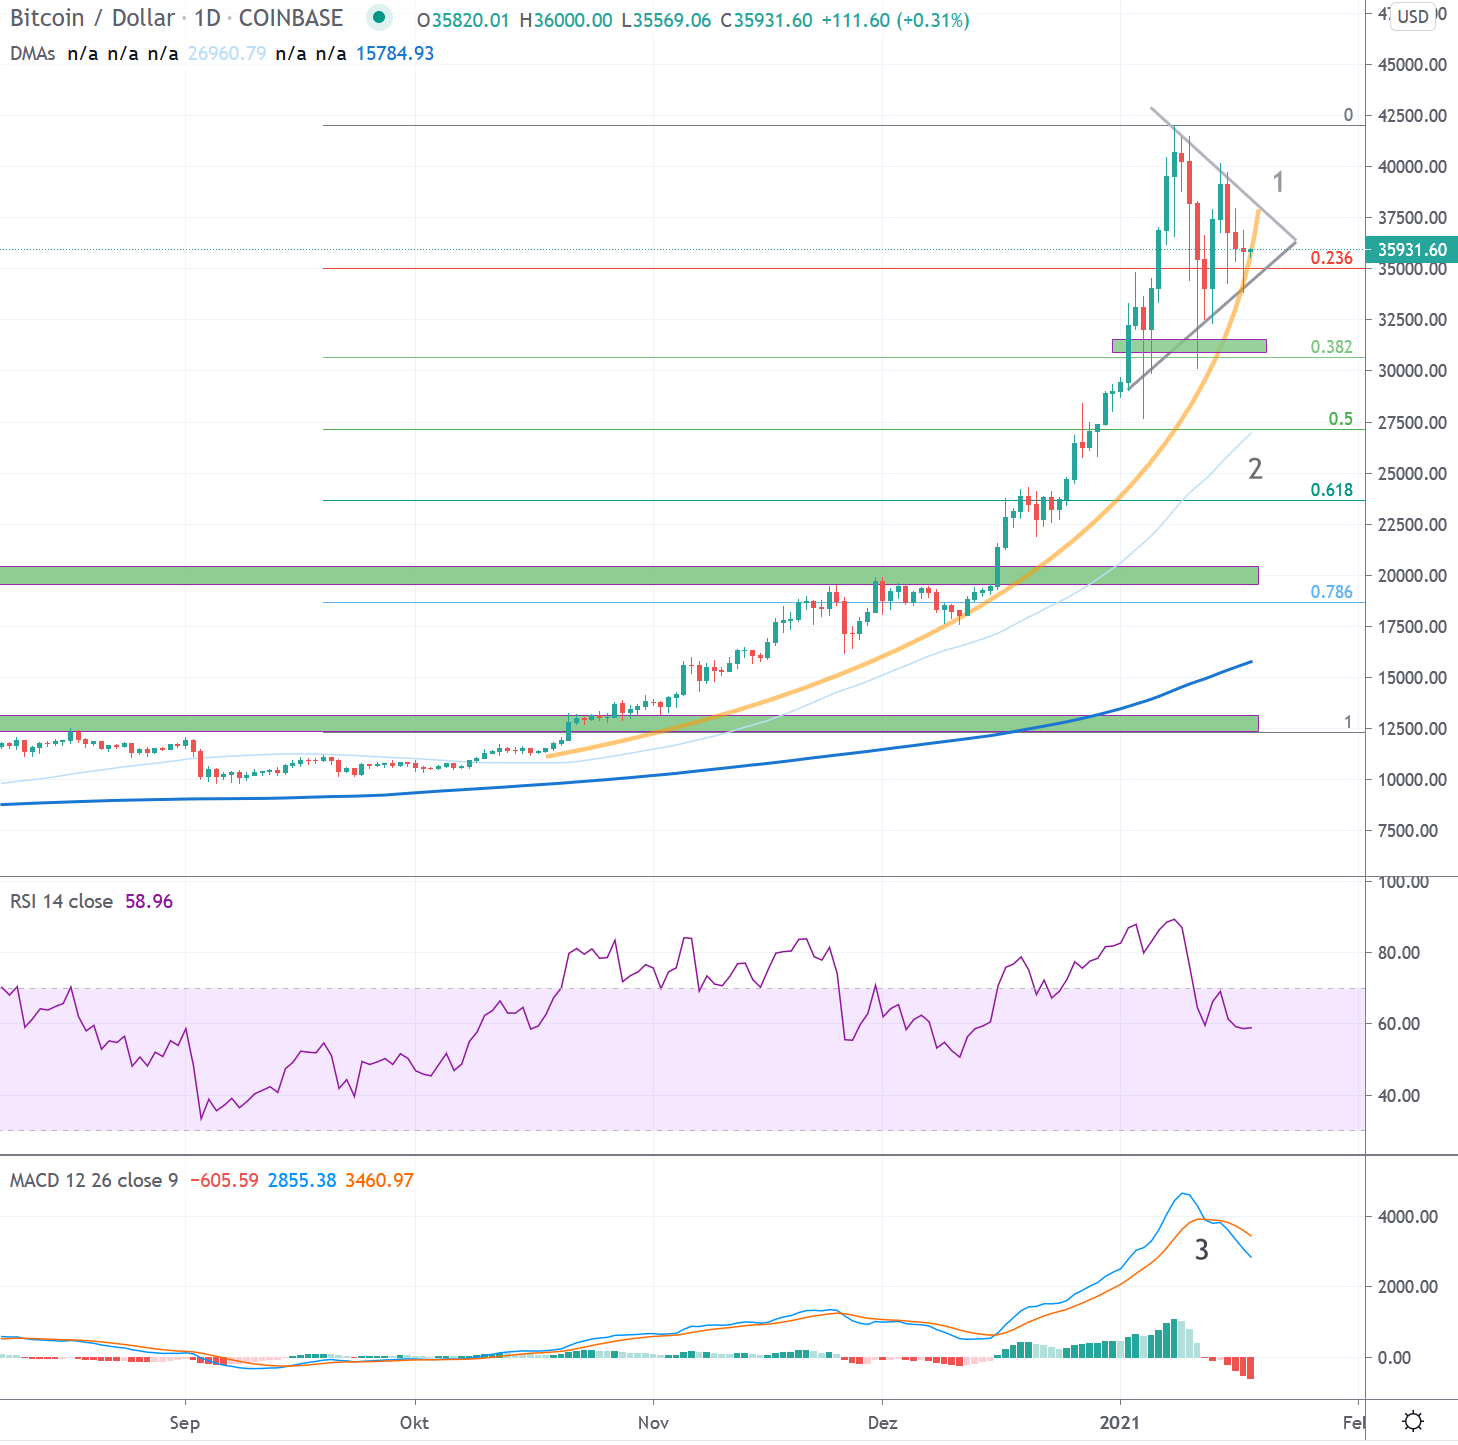
The sustained breakout through USD 20,000 in mid-December initially led to the USD 24,000 zone, where the price consolidated for a good week. This was followed by impressive price jumps, which only allowed the price to briefly consolidate again in the USD 32,000 area. A renewed upward thrust in the previous week led the Bitcoin price to a new all-time high of around 42,000 USD.
Outlook
Since the breakout through the important 14,000 resistance at the beginning of November, the price has gone from strength to strength. The breakout through the old all-time high at USD 20,000 saw a strong accentuation of the uptrend, which most recently sent the Bitcoin price into a parabolic rise. Price discovery beyond the historical highs and thus in the unexplored territory is the current market mode. In the reporting week, a larger correction set in for the first time since the beginning of the rise, which caused the Bitcoin price to snap back to the first support zone around USD 32,000.
A failure to regain the recently recorded highs now leads to the formation of a symmetrical triangle, which could soon give a clue about the continuation or termination of the accentuated upward movement. It remains to be seen whether this represents the beginning of a longer correction or just a consolidation before the next high. In this regard, the most recently reached resistance levels above 40,000 USD, as well as the support zones between 30,000 – 32,000 USD remain to be observed. The correction led to a cooling of the indicators RSI and MACD, whereby the latter has completed a crossing at an extremely high level in the daily interval (3).
For a sustainable establishment of the uptrend, the recently overcome resistances should be respected as support in the coming weeks (green). The last short-term consolidation occurred in the zone USD 32,000 to 30,000 and continues to serve as initial support. More fundamentally, the area above USD 24,000 becomes fundamental. This zone contains the 50-day moving average and the 0.618 Fibonacci point that has been calculated since the beginning of the parabola and the all-time high (2). This is followed by another support zone near 20,000 USD.
Macro: New all-time highs
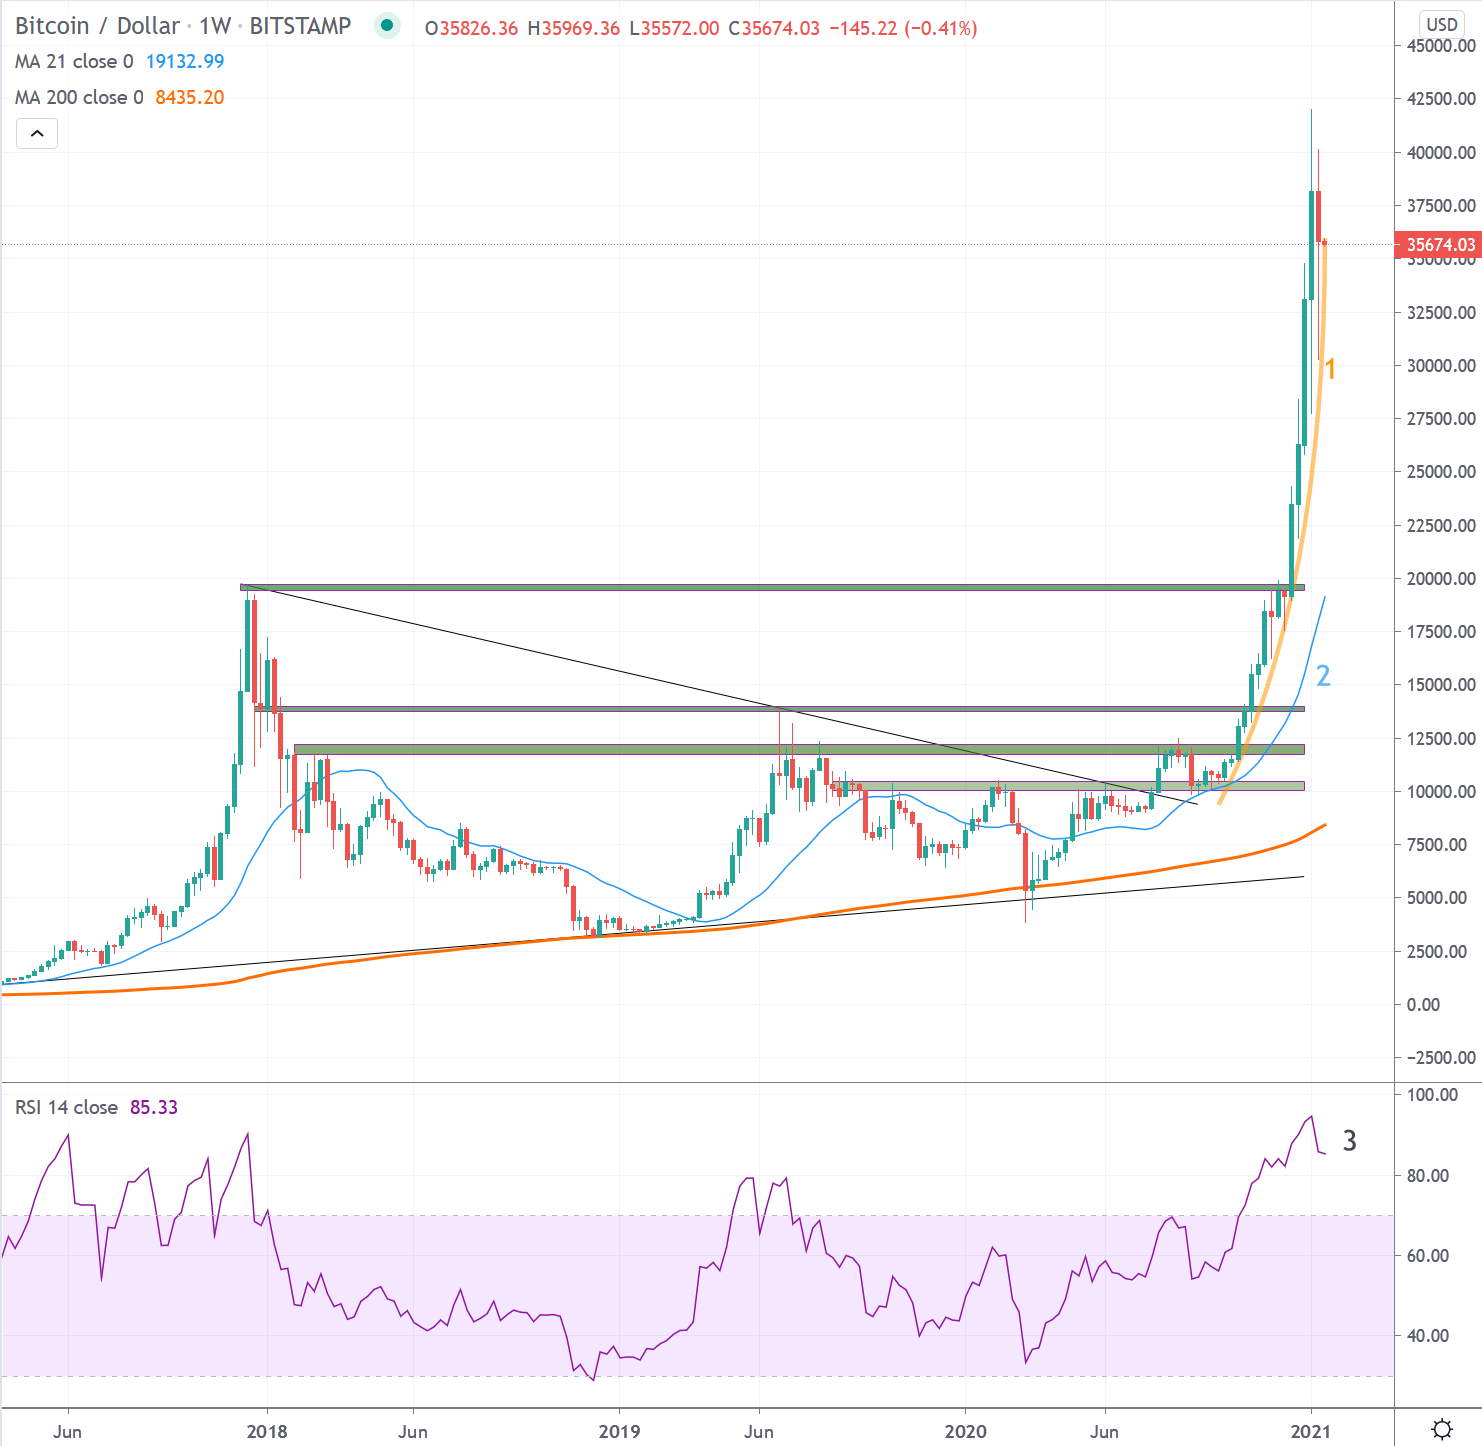
Bitcoin was able to set a higher high above 10’000 USD for the first time in the weekly interval in 2020, which broke the prevailing bearish trend since December 2017. This broke the series of lower highs that lasted for 135 weeks.
Since the break of the bearish trend, the signs of a valid trend reversal became stronger. With the break through important resistance zones and a continuous development above the 21-week average (2), the probabilities for a renewed reaching of the all-time high created in 2017/18 increased. This was accomplished in mid-December 2020.
With the price movements in the past year, a good foundation was created to sustainably climb new spheres beyond the all-time highs reached in 2017. The break of USD 20,000 impressively demonstrated the power of the upward movement that had been established since October and resulted in a parabola (1). Corrections become more likely after such accentuated price increases. This is what happened during the reporting week. In case of a continued correction, sustained respect of the newly created supports (green) over the next weeks/months will be required to decisively advance into new price spheres in the upcoming period. The first support in the weekly interval is located at around USD 20,000. Significant is the support zone 17’000-14’000 USD, which is characterized by historical price movements as well as the 21-week average (1).
*Originally posted at CVJ.CH
Disclaimer
All information in this publication is provided for general information purposes only. The information provided in this publication does not constitute investment advice and is not intended as such. This publication does not constitute and is not intended as an offer, recommendation or solicitation to invest in any financial instrument, including cryptocurrencies and the like. The contents contained in the publication represent the personal opinions of the respective authors and are not suitable or intended as a basis for decision-making.
Risk notice
Investing in cryptocurrencies, is fundamentally associated with risk. The total loss of the invested capital cannot be excluded. Cryptocurrencies are very volatile and can therefore be exposed to extreme price fluctuations in a short period of time.
