
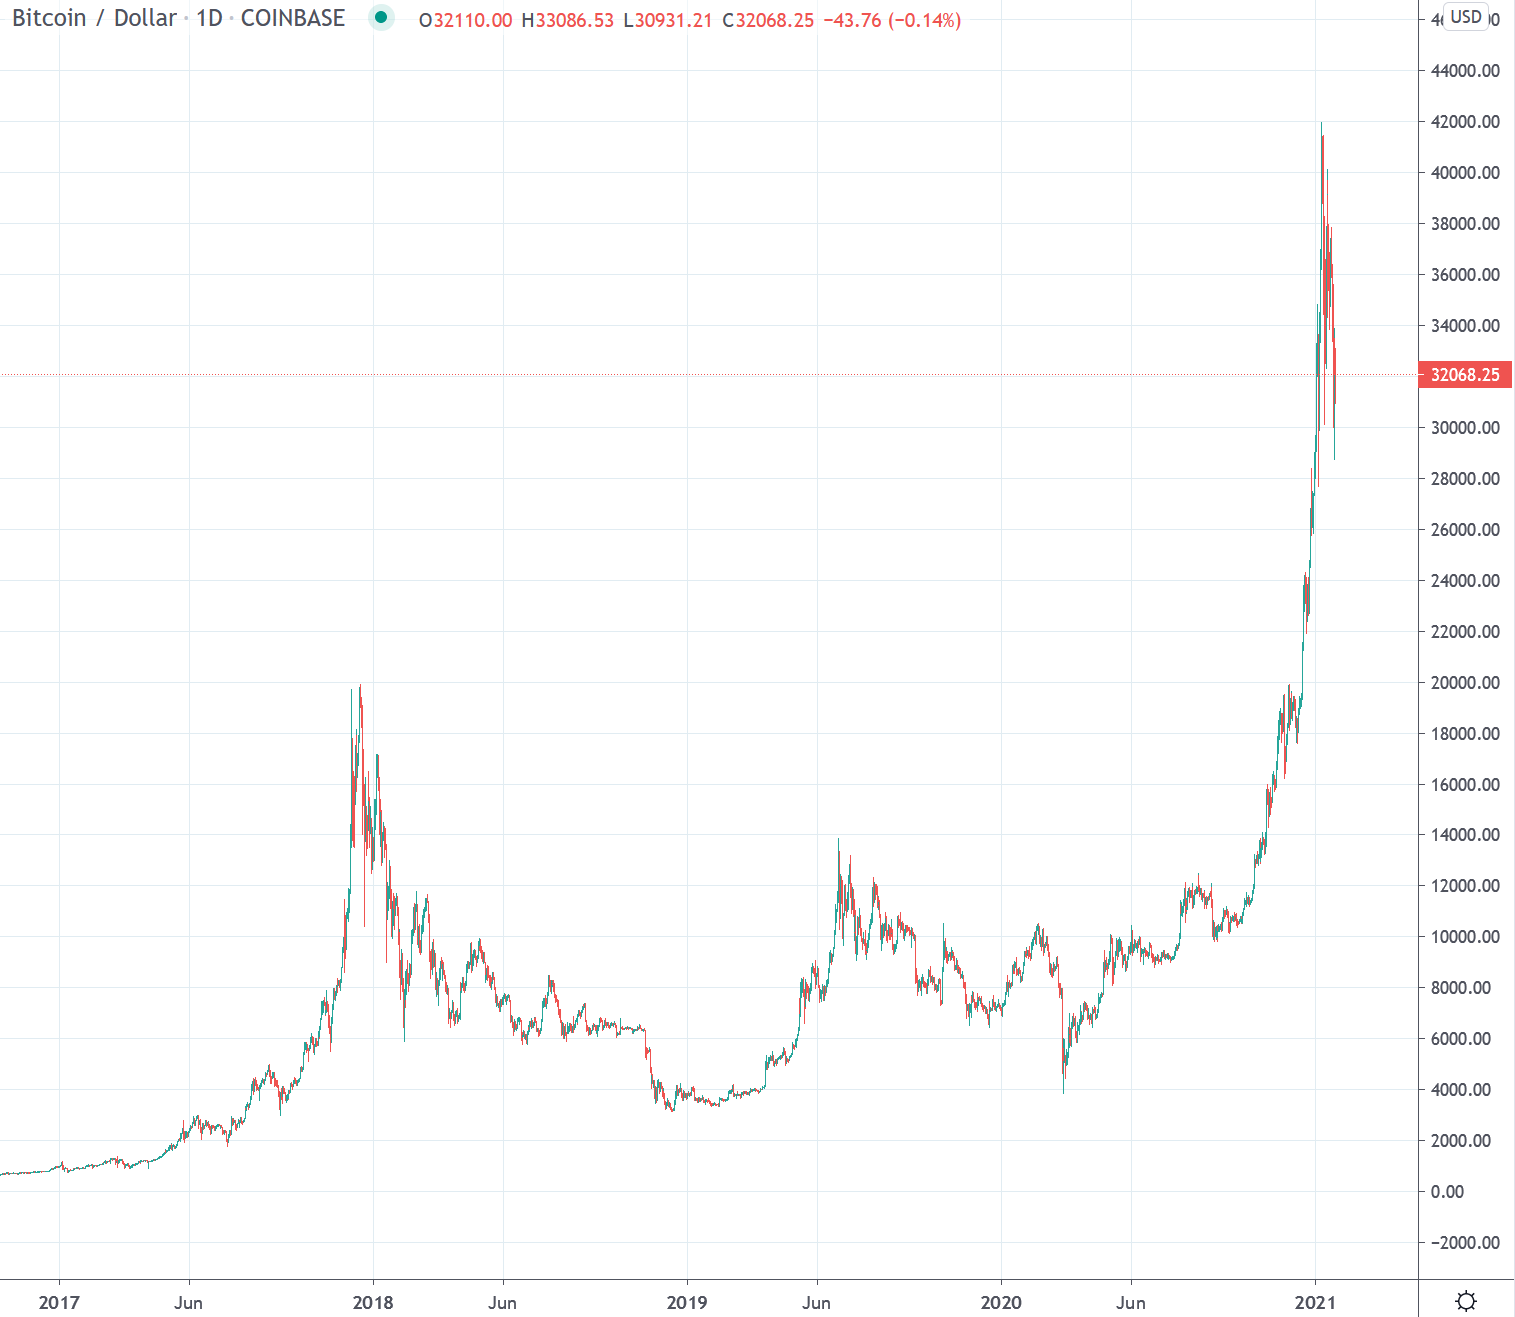
Bitcoin USD daily basis
Bitcoin USD Chart Analysis – Continued Consolidation with Lower Highs
At the beginning of the week we saw a continuation of the consolidation phase, which started when the all-time high was reached on January 8. In the process, the USD 35’000 mark served alternately as a support and resistance zone. Thus, Bitcoin traded above this zone on Monday, as well as on Tuesday with daily trading ranges between 6-8%. On Wednesday, another test of the aforementioned support followed, which led the price to USD 33’430 at the daily low. However, the daily close took place at 35’570 but again above the 35’000 USD mark. The lower trendline of the previously established symmetrical triangle thus became more vulnerable. On Thursday, the biggest price decline of the week followed with the break of this line with -13.3%, which let the Bitcoin price close at 30’790 USD. On Friday, a renewed correction led to 28’750 USD, but the daily close took place significantly higher at 30’790 USD. Although the 33’000 level was briefly broken through at the daily high on Saturday, the weekend was again characterized by losses. These led Bitcoin back to USD 32’000 at the end of the week. The last two days were characterized by lower daily highs and lows and sharply declining volume.
Exuberant price discovery comes to a temporary end
Review Daily Interval
After the price plunge in mid-March 2020, a veritable countermovement established itself. This led to the resistance zones at 10’000 USD. After an initial rejection and a consolidation phase lasting almost two months, a breakout through the fundamental resistance zone followed on July 27, which had been established since August 2019 and had already caused Bitcoin to fail a few times to date.
The resistance zone around USD 10’000 was interesting in several respects. On the one hand, the 0.618 Fibonacci point of the entire downward movement, which was initiated at the end of June 2019 just below 14’000 USD, is located here. On the other hand, the zone around USD 10’000 simultaneously acted as a confirmation of the still bearish trend from lower highs since December 2017 (see macro view on a weekly basis). Bitcoin was able to establish itself above the newly created support in the USD 10’000 area since the end of July 2020, and provided a first confirmation of a trend reversal with the break of the resistance zone around USD 12’200 towards the end of October 2020. The aforementioned resistance zone had been effective since January 2018 and served as a zenith for the price several times since then. In the following weeks, the positive trend accentuated and led Bitcoin through the 14’000 resistance in early November 2020 and close to the then all-time highs around 20’000 USD for the first time in early December, which remained untouched for 158 weeks since the bull market in 2017.
Since the breakout through the important 14’000 resistance at the beginning of November, it has been blow by blow. The break through the old all-time high at USD 20’000 saw a strong accentuation of the uptrend. The continued parabolic upward movement led to a new all-time high at 42’000 USD and came to a temporary end on January 8.
Outlook
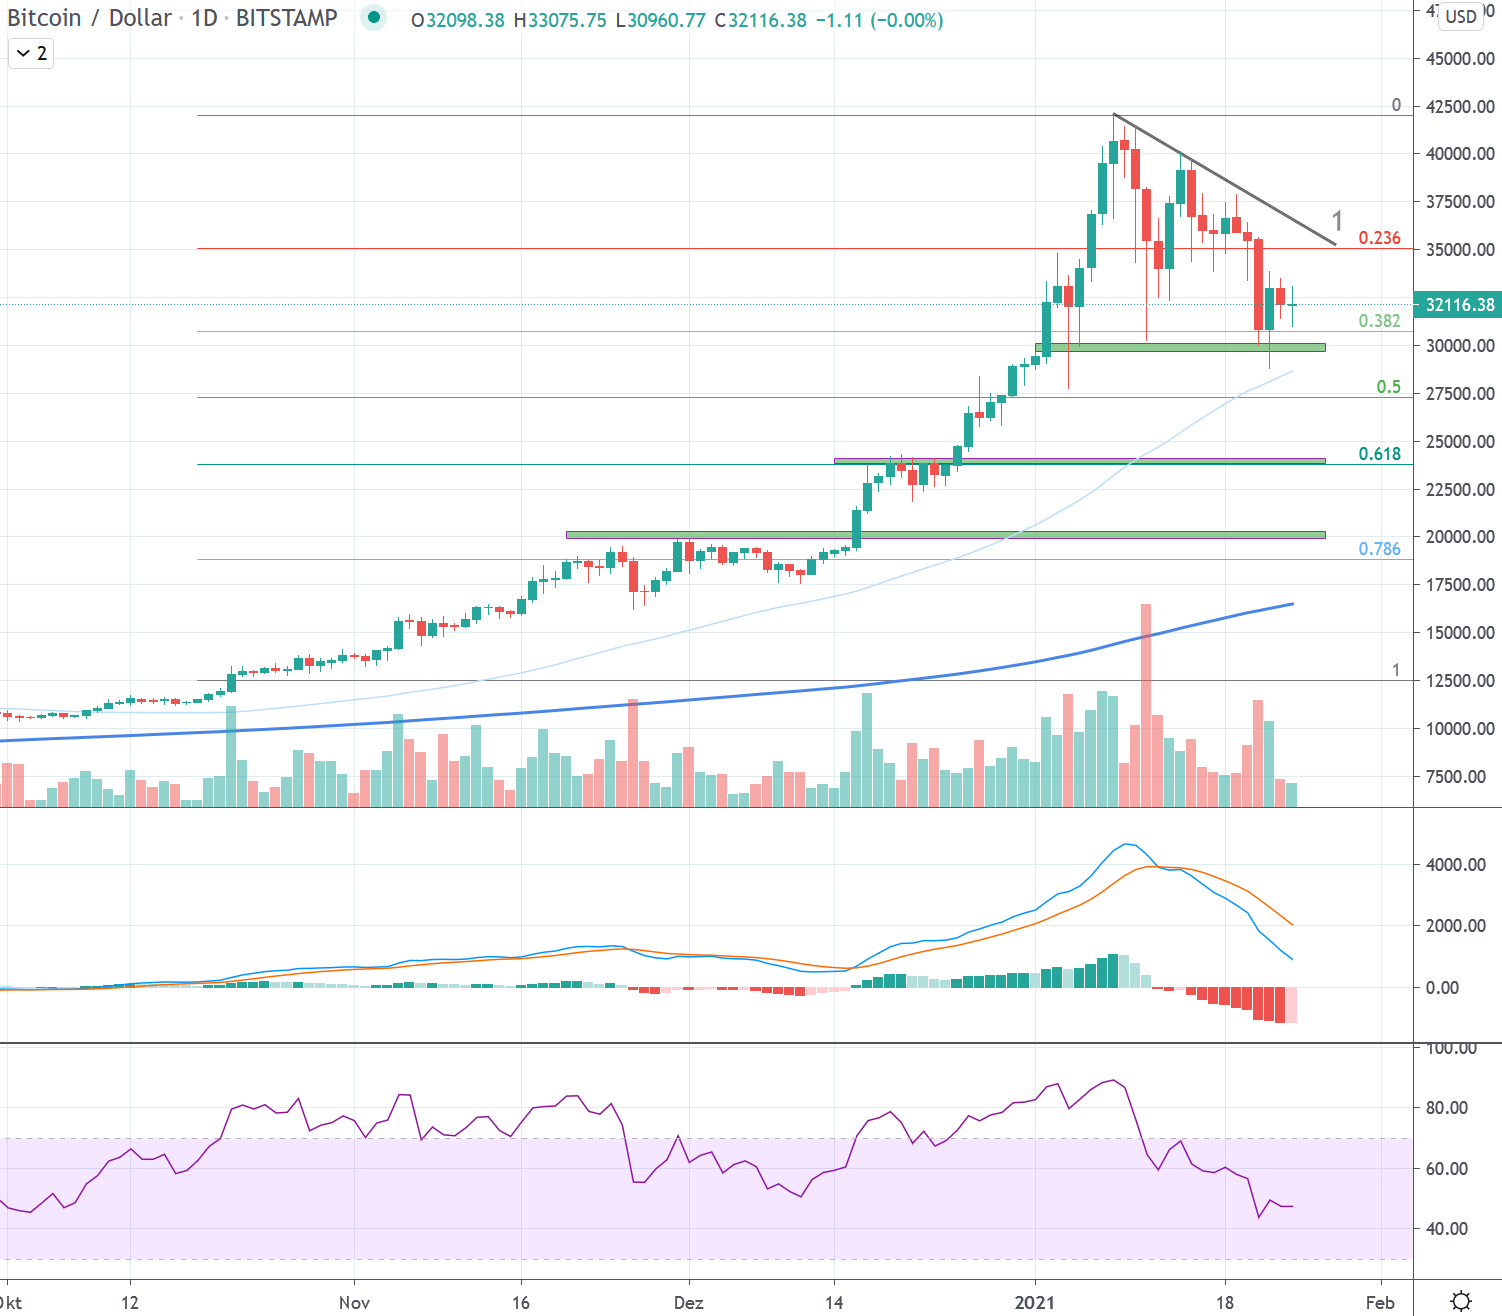
Since the all-time high, a symmetrical triangle formed with several corrections reaching the USD 30’000 zone with decreasing volatility, signaling a first potential fork in the road. During the reporting week, the bitcoin price broke the lower trend line and has been consolidating above the first support zone between 29’000 and 30’000 (green) from now on.
It remains to be seen whether this is the beginning of a more pronounced correction or just a short-term consolidation. The price structure on a daily basis, with lower frequent increases in tests of the support zone around 30’000 USD is to be seen negatively. Only a break through the 35’000 resistance zone would negate this constellation (1). This level has often served as support since the all-time high, and the trend line of the lower daily highs formed since the all-time high is also located in this area.
For a sustainable establishment of the upward trend, the recently overcome resistances should be respected as support in the coming weeks (green). Just below the first support zone is the 50-day moving average (light blue line). More fundamental support is expected around USD 25’000. In this area is the 0.618 Fibonacci point, which has been calculated since the beginning of the breakout through important resistance zones in October and the all-time high (2). This is followed by another support zone near the old all-time high at around USD 20’000.
Macro: New all-time highs
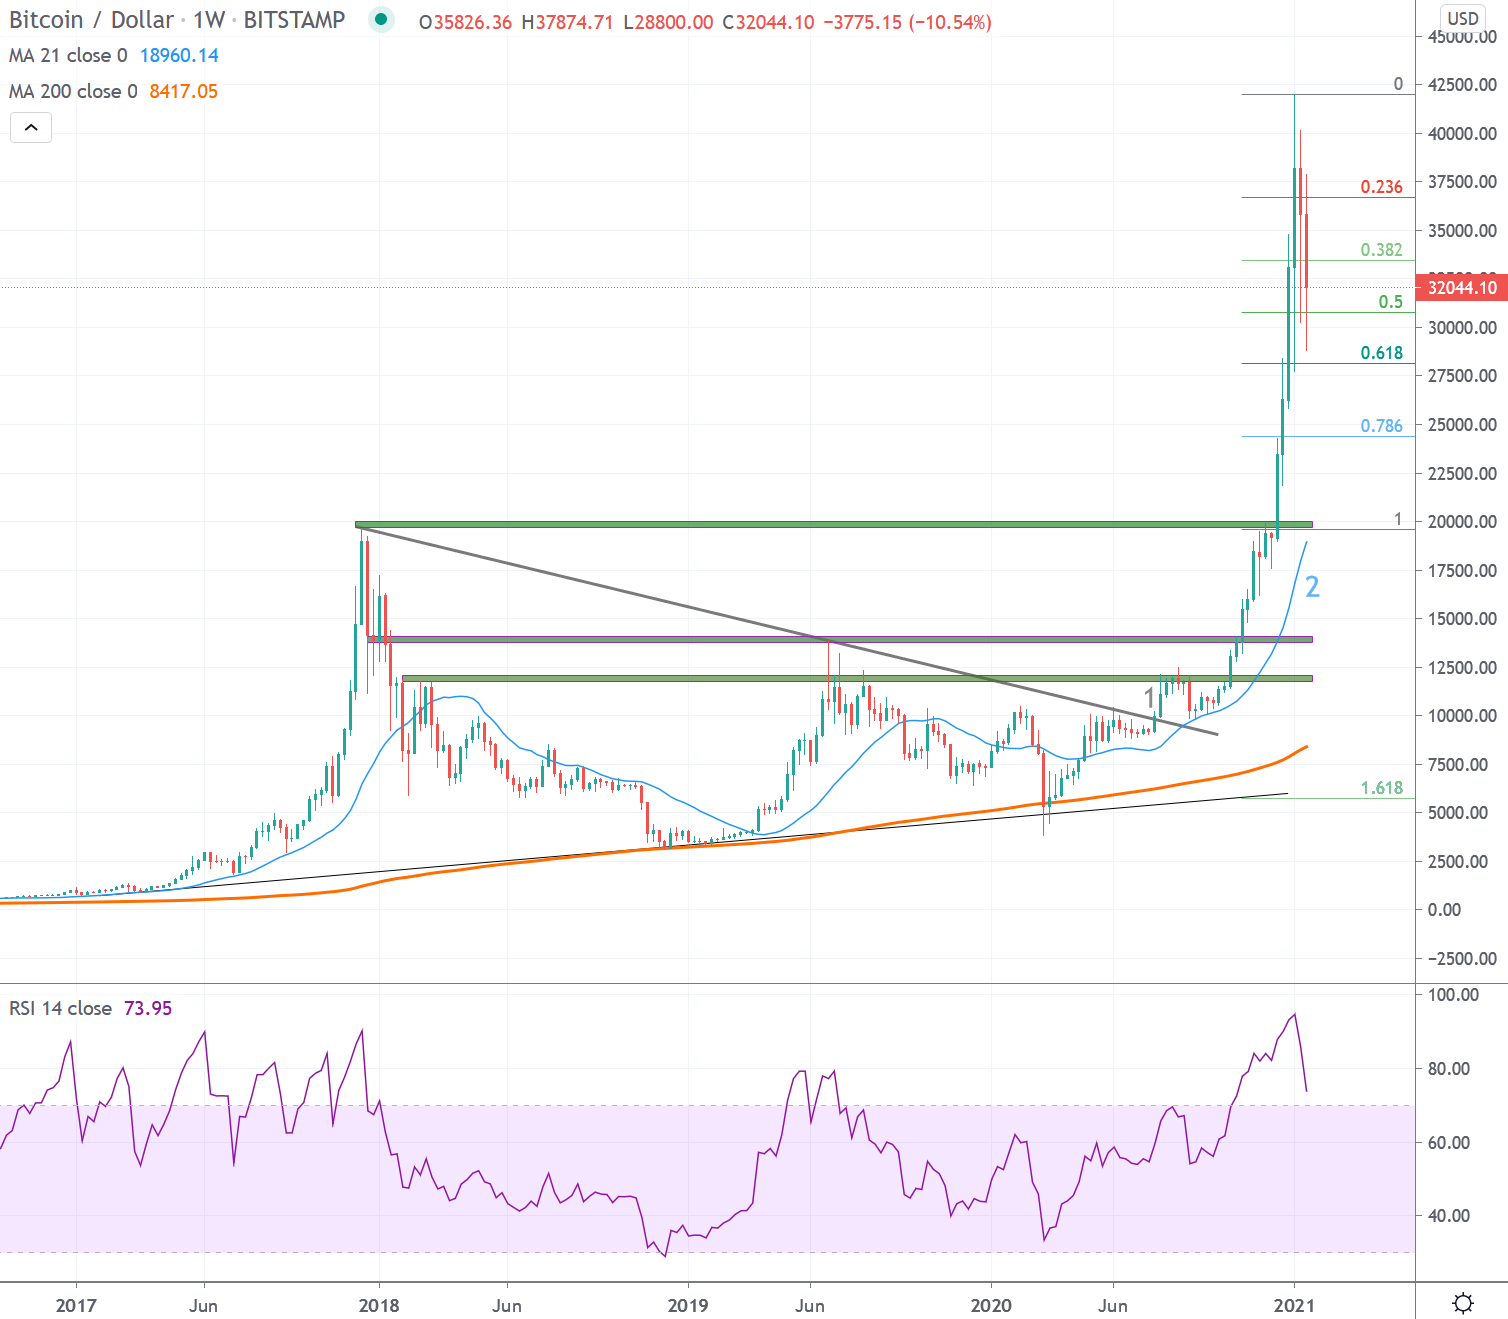
Bitcoin was able to set a higher high above USD 10’000 in the weekly interval for the first time in 2020, which broke the prevailing bearish trend since December 2017. This broke the series of lower highs that lasted for 135 weeks (1).
Since the break of the bearish trend, signs of a valid trend reversal have been building up. With the push through important resistance zones and a continuous development above the 21-week average (2), the probabilities for a renewed reaching of the all-time high created in 2017/18 increased. This was accomplished in mid-December 2020. Since then, a strongly accentuated price discovery above this mark has been taking place.
With the price movements in the past year, a good foundation was created to sustainably climb new spheres beyond the all-time highs reached in 2017. The break of USD 20’000 impressively demonstrated the power of the upward movement that had been established since October. It culminated in a parabola, which reached its preliminary high at a good USD 42’000. Corrections become more likely after such accentuated price increases. Such a correction has now been taking place for two weeks. As a first support, the zone above 28’000 USD can be considered. Here is the 0.618 Fibonacci point, which has been calculated since the breakout above 20’000 USD and the current all-time high.
In case of a continued correction, a sustainable respect of the previously created supports (green) over the next weeks/months will be required in order to continue to decisively advance into new price spheres in the future. The first support in the weekly interval is located at around USD 20’000. This support zone is gaining in significance, as the 21-week average is now also approaching the area. The area between 14’000 and 12’000 USD serves as further support zones. However, reaching these levels would cause lasting damage to the entire structure.
*Originally posted at CVJ.CH
Disclaimer
All information in this publication is provided for general information purposes only. The information provided in this publication does not constitute investment advice and is not intended as such. This publication does not constitute and is not intended as an offer, recommendation or solicitation to invest in any financial instrument, including cryptocurrencies and the like. The contents contained in the publication represent the personal opinions of the respective authors and are not suitable or intended as a basis for decision-making.
Risk notice
Investing in cryptocurrencies, is fundamentally associated with risk. The total loss of the invested capital cannot be excluded. Cryptocurrencies are very volatile and can therefore be exposed to extreme price fluctuations in a short period of time.
