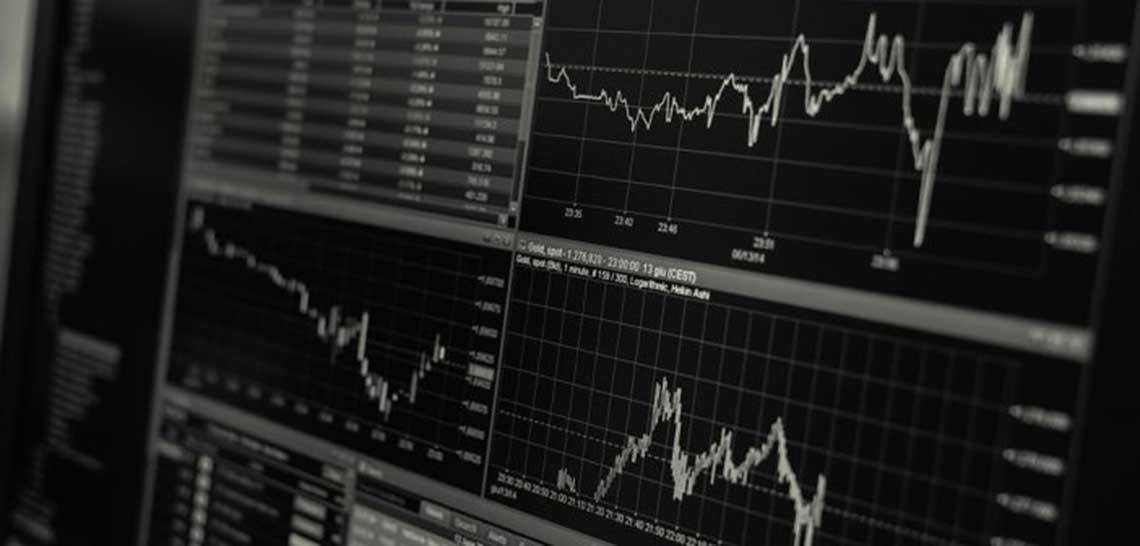
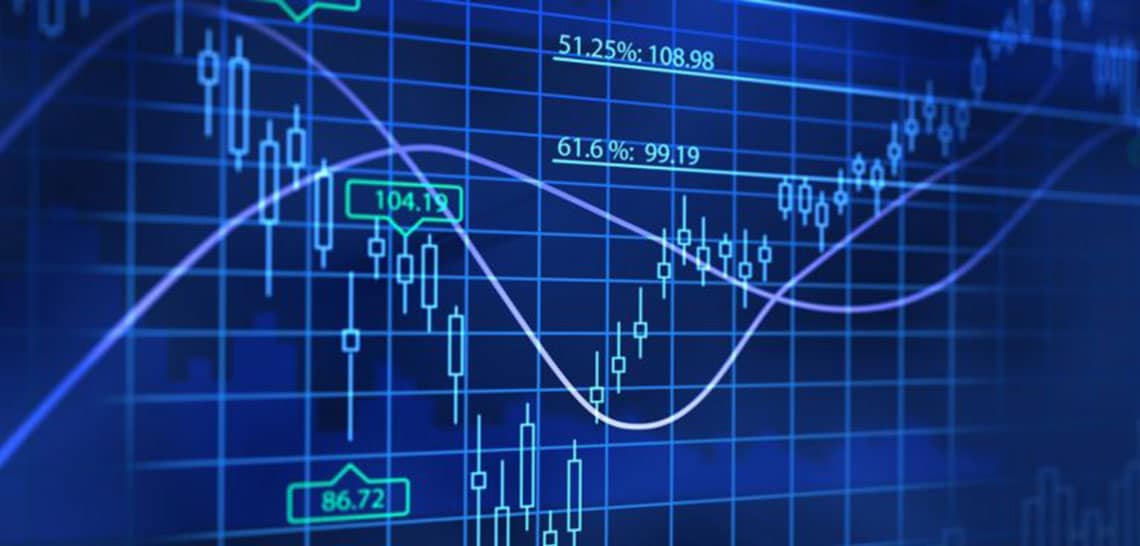
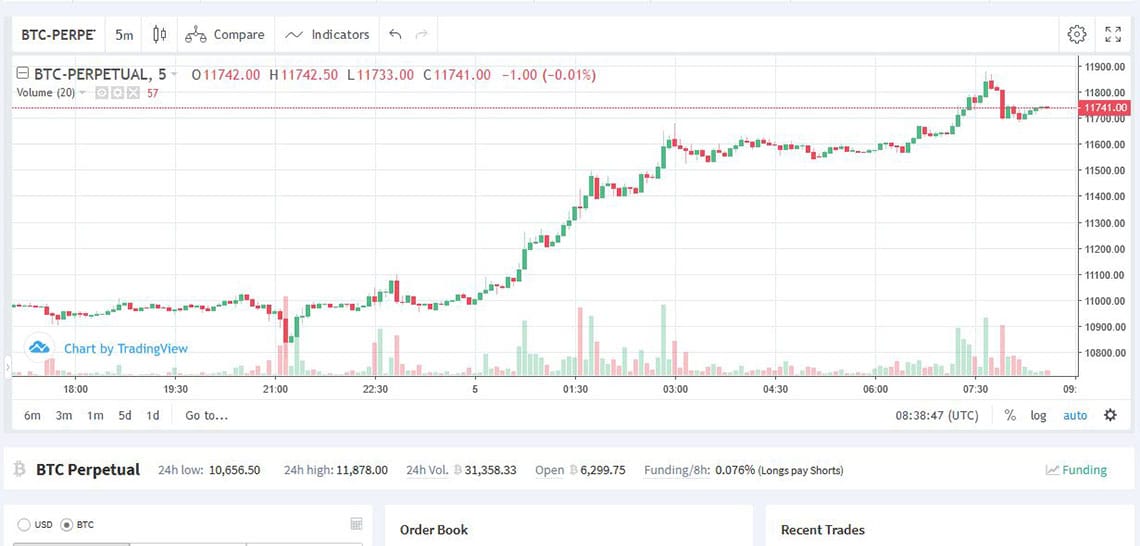
Technical analysis (TA) is an observation of the historical price movements of an asset.These observations are used to discuss possible future forecasts. Technical analysis is a frequently used instrument in trading with various assets. TA is particularly popular in trading with crypto-currencies, as the price is determined exclusively by supply and demand of the market participants. As different as the approaches to analyze a price trend may be, there are a few common denominators: Principles of Technical Analysis The only basis for decision-making is the price trend. This reflects the historical investor(s) behaviour. It reflects sentiment, rational and irrational decisions. Through the information acquired via TA, a forecast can be generated from historically recurring patterns. The current price is the equilibrium between supply and demand of all market participants; effectively it is a weighted factor that reflects all opinions and decisions. Thus, the TA deals exclusively with the price development. Fundamental data is not important. Because of this, TA of prices are not an exact science. Due to the mass of indicators, their formations and interrelationships, price charts can be interpreted in many ways. Even the selected time interval can provide different results on the possible future course of prices. Price movements are not purely coincidental. Trends arise. It is preferably traded with the trend (trend is your friend). The chances are better to earn money with the trend than against a prevailing trend. The trading volume confirms, confirms a trend. TA only works when trading activity is brisk, i.e. when price movements are meaningful. Technical analysis does not predict the future “Forecasts are based on probability, not on a result that can be expected with certainty. The aim is to identify trading opportunities with a low risk and potentially high return profile”. The approaches of technical analysis and their interpretations are diverse and extensive. There is a huge selection of approaches and approaches. Therefore, one should not strictly cram the approaches, but find out the best approach for oneself personally. An introduction to technical analysis can be found here. Rules, which you should follow when trading, can be found here. * Originally published in German at CVJ.ch


